AI Analyst for Dashboards
AI Analyst for Dashboards lets you interact with your dashboard using natural language. You can ask questions about your dashboard data, generate an AI-powered summary, and control which data AI Analyst can use when answering questions.
AI Analyst can be configured at the dashboard level and is available for both application and embedded dashboards.
What You Can Do with AI Analyst
Section titled “What You Can Do with AI Analyst”With AI Analyst, you can:
- Summarize a dashboard to quickly understand key insights from the dashboard.
- Ask questions in natural language without manually analyzing individual charts or reports.
- Control the data scope used by AI Analyst when answering questions.
- Configure which pages and tiles are included when generating a dashboard summary.
- Provide prompts to guide the AI Analyst toward specific insights.
- Enable or disable AI Analyst for a dashboard.
Configure AI Analyst
Section titled “Configure AI Analyst”Before using AI Analyst, configure it from the dashboard settings.
Navigation
Section titled “Navigation”Dashboard → Settings → AI Assistant
- Open the dashboard for which you want to configure AI Analyst.
- Click Settings.
- In the left navigation panel, select AI Assistant.
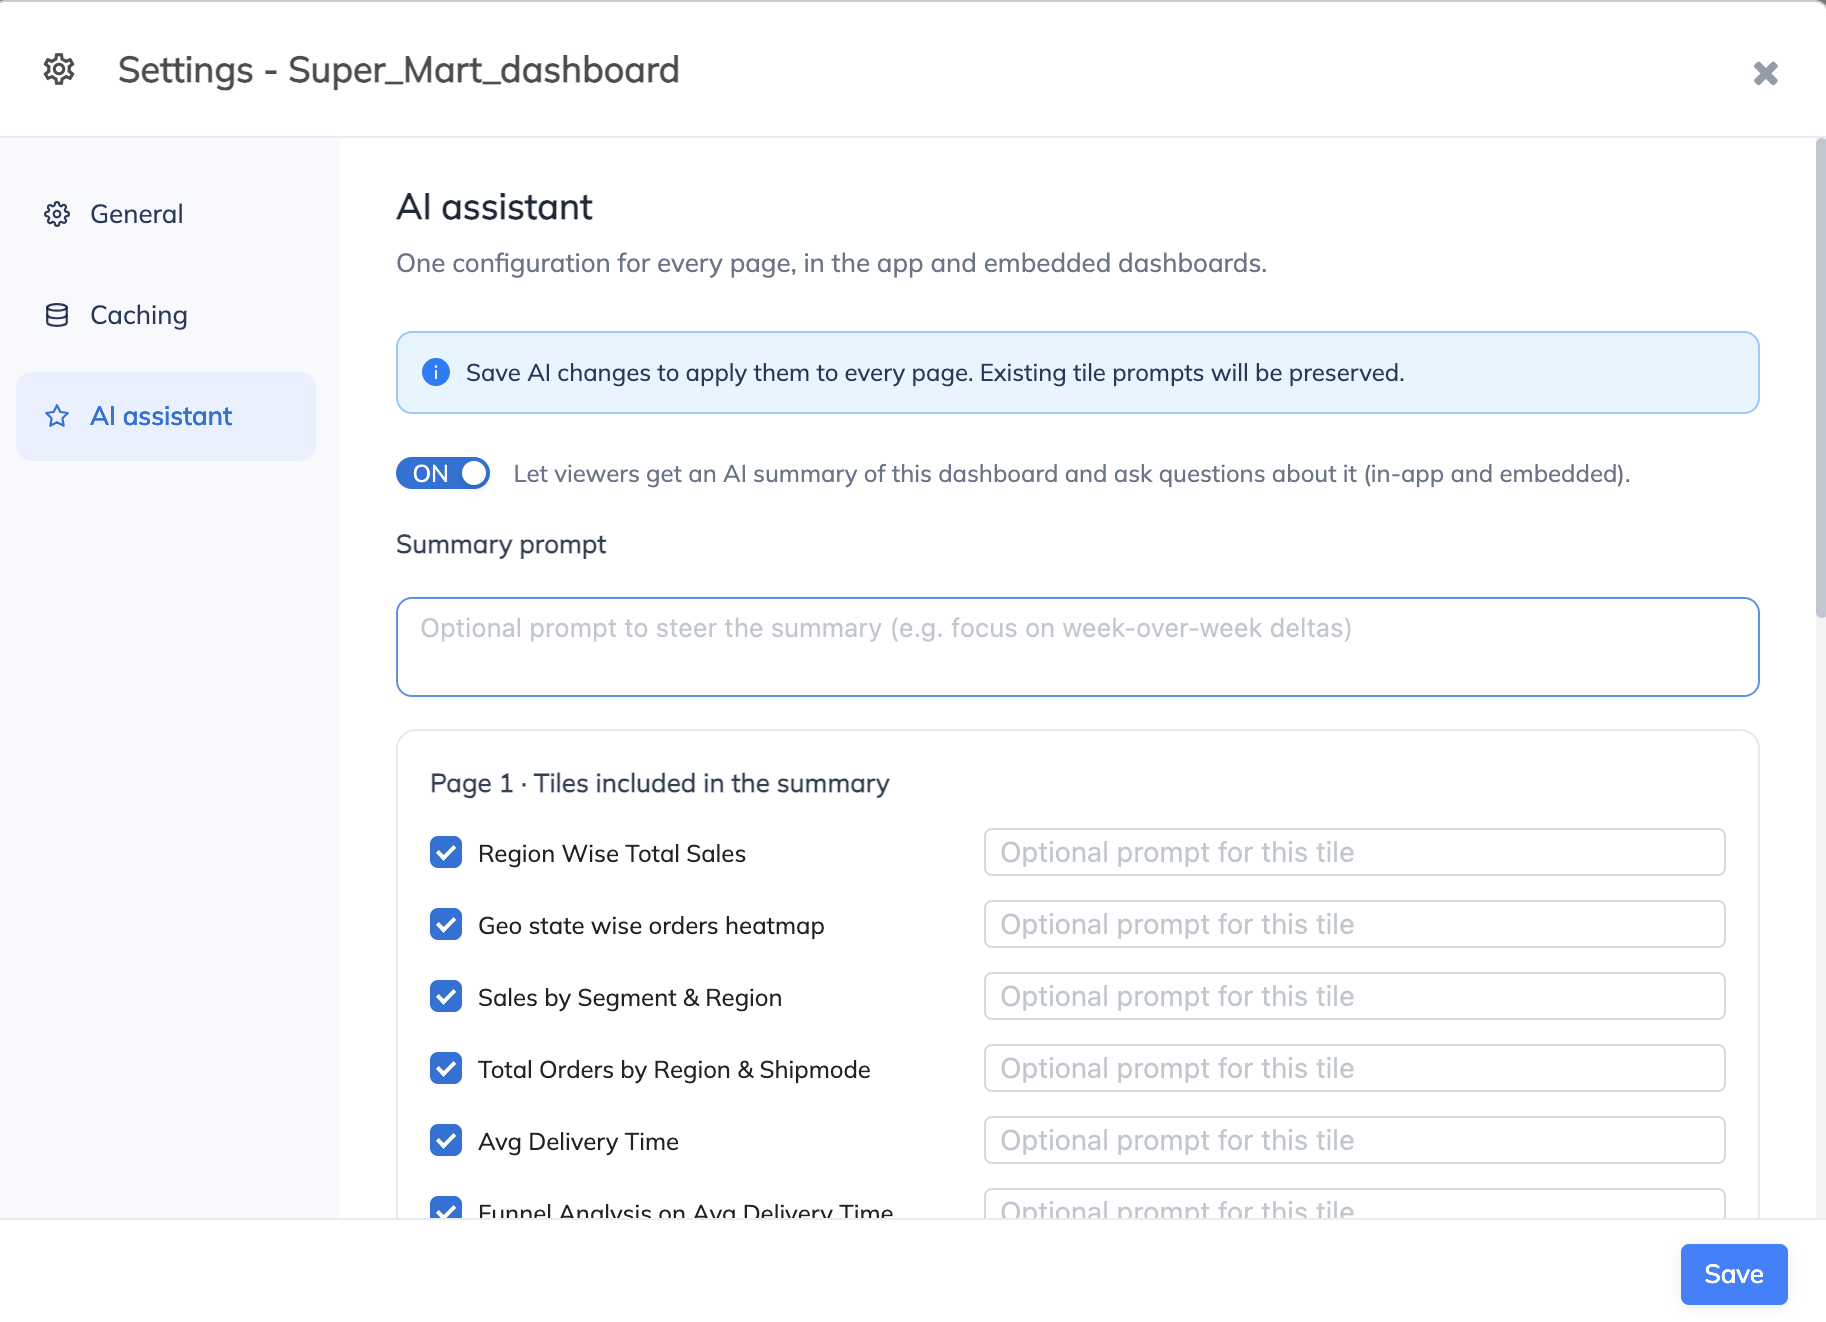
The AI Assistant section contains all configuration options for AI Analyst.
Enable AI Analyst
Section titled “Enable AI Analyst”Use the toggle in AI Assistant to enable or disable the feature for the dashboard.
When enabled, users can access Dashboard AI from the dashboard and ask questions about the available data.
When disabled, Dashboard AI is not available on the dashboard.
Note: Click Save to apply the AI Analyst configuration.
Configure Dashboard Summary
Section titled “Configure Dashboard Summary”Once AI Analyst is enabled, you can configure how the dashboard summary is generated.
Summary Prompt
Section titled “Summary Prompt”The Summary prompt is optional and allows you to provide instructions that guide the AI when generating the dashboard summary.
For example:
Focus on week-over-week changes and highlight any significant changes in sales.
If no summary prompt is provided, AI Analyst generates a general summary based on the configured dashboard data.
Select Pages and Tiles
Section titled “Select Pages and Tiles”You can control which dashboard pages and tiles are included when generating the AI summary.
For each page, select the tiles or reports that should be considered when generating the summary.
You can also provide an optional prompt for individual tiles to guide the AI on what it should focus on for that tile.
For example, for a Region Wise Total Sales tile, you can provide:
Highlight the regions with the highest and lowest sales.
This allows the generated summary to focus on the information that is most relevant to your users.
Configure Allowed Scopes
Section titled “Configure Allowed Scopes”The Allowed scopes determine which data AI Analyst can use when answering questions.
You can enable one or more of the following scopes:
| Scope | Description |
|---|---|
| On screen | Uses only the numbers already displayed on the dashboard with the current filters. No new queries are generated. |
| Dashboard tables | Runs new queries, limited to the tables behind the dashboard. |
| Entire project | Runs new queries against any table the user can access in the project. |
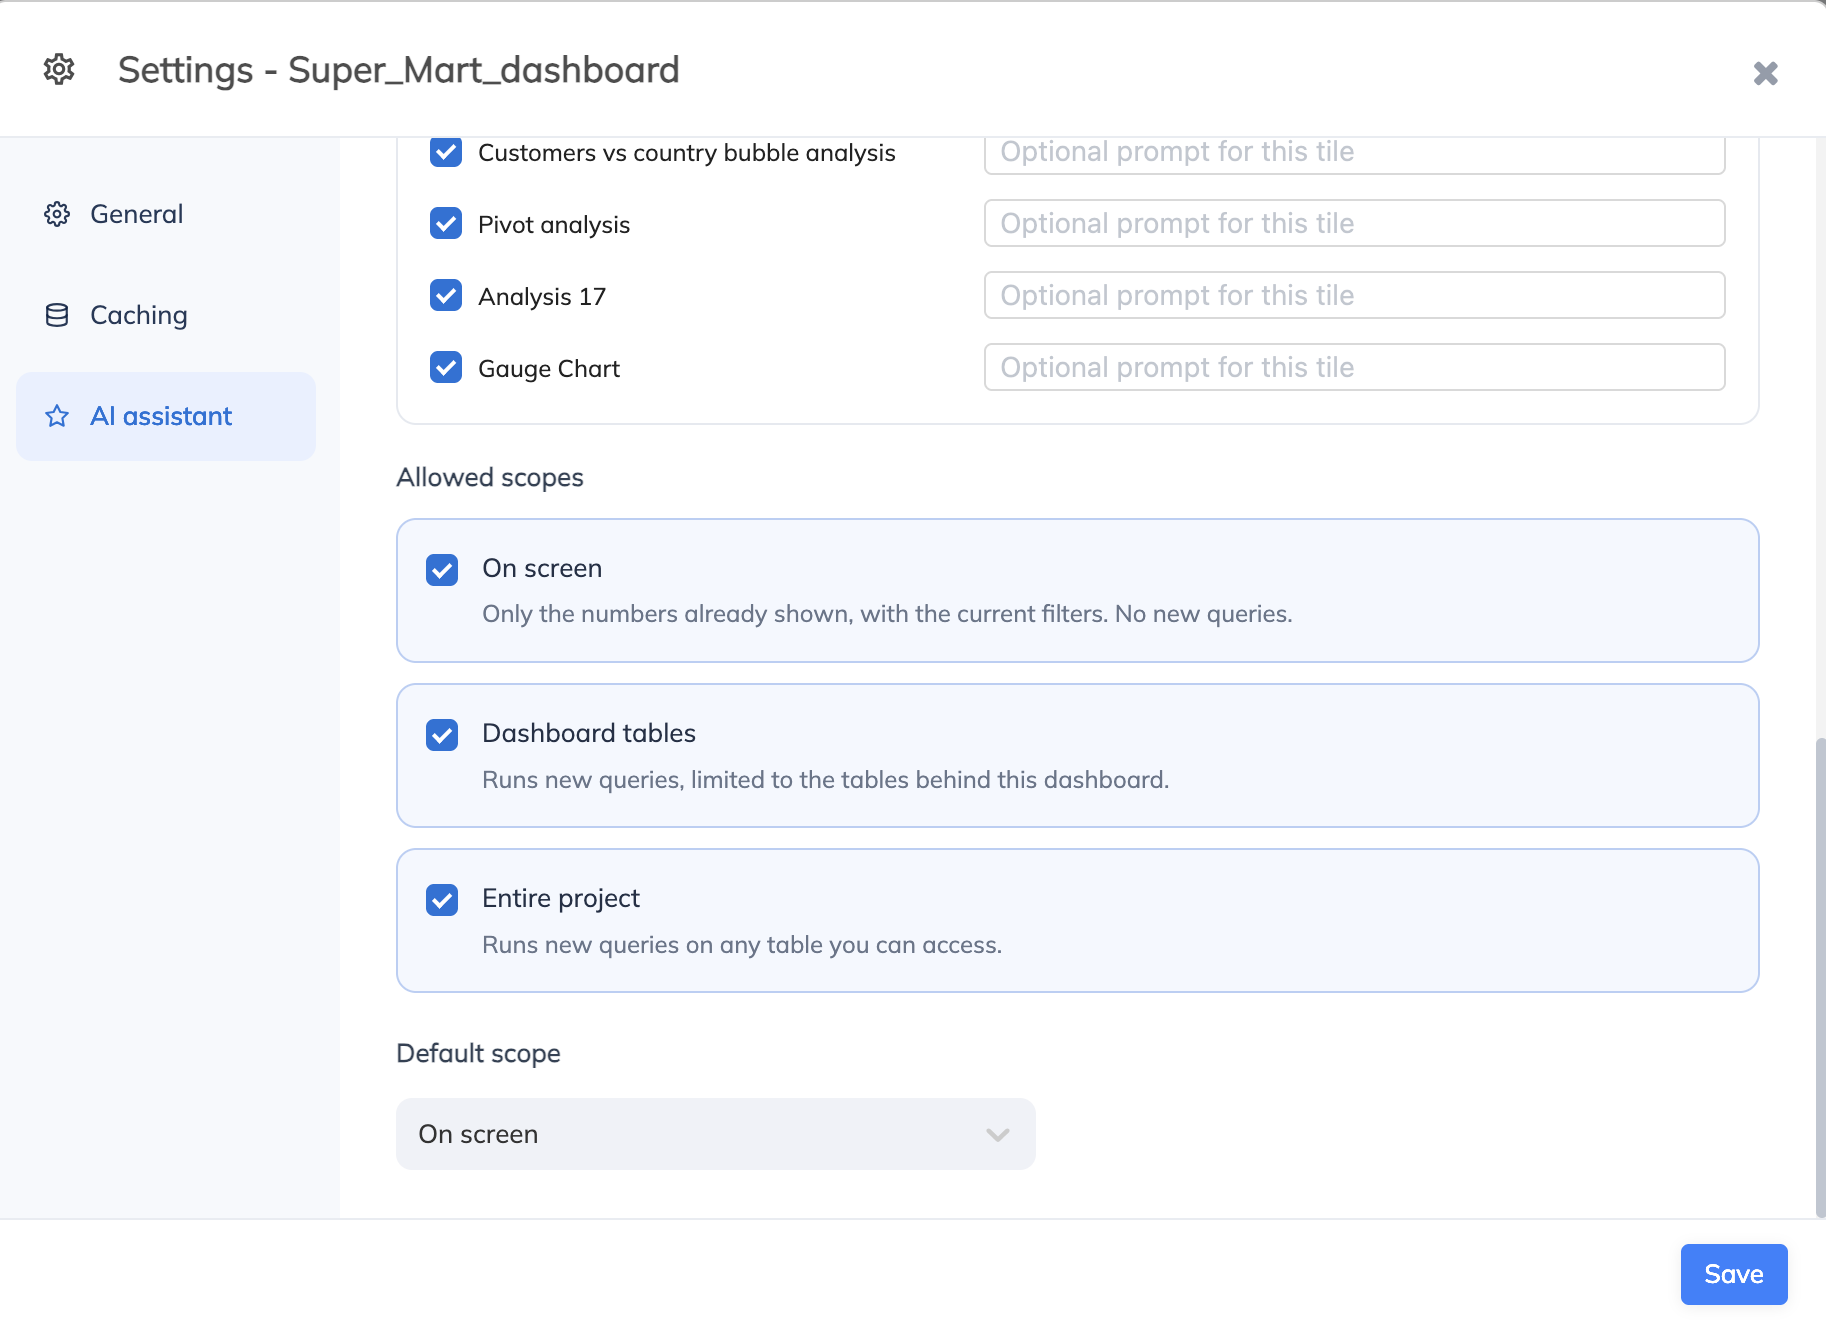
On screen
Section titled “On screen”When On screen is selected, AI Analyst uses only the data currently displayed on the dashboard, including the current filter selections.
No new queries are generated.
Use this scope when you want AI Analyst to answer questions strictly based on what is currently visible on the dashboard.
Dashboard tables
Section titled “Dashboard tables”When Dashboard tables is selected, AI Analyst can run new queries against the tables used by the dashboard.
This allows AI Analyst to perform additional analysis beyond the numbers currently displayed on the screen.
Entire project
Section titled “Entire project”When Entire project is selected, AI Analyst can run new queries against any table that the user has access to within the project.
This provides the broadest data scope and allows users to ask questions that may require data beyond the dashboard.
Important: AI Analyst can only access data that the user has permission to access.
Set the Default Scope
Section titled “Set the Default Scope”The Default scope determines which scope is selected automatically when a user opens Dashboard AI.
For example, if On screen is selected as the default scope, Dashboard AI opens with On screen selected.
To change the default scope:
- Go to Dashboard → Settings → AI Assistant.
- Under Default scope, select the required scope.
- Click Save.
The default scope can also be changed by the user at runtime, provided the selected scope has been enabled under Allowed scopes.
Use AI Analyst
Section titled “Use AI Analyst”Once AI Analyst is enabled and the configuration is saved, you can access it directly from the dashboard.
Open Dashboard AI
Section titled “Open Dashboard AI”- Open the configured dashboard.
- Click the Dashboard AI icon in the top-right corner of the dashboard.
- The Dashboard AI panel opens on the right side of the dashboard.
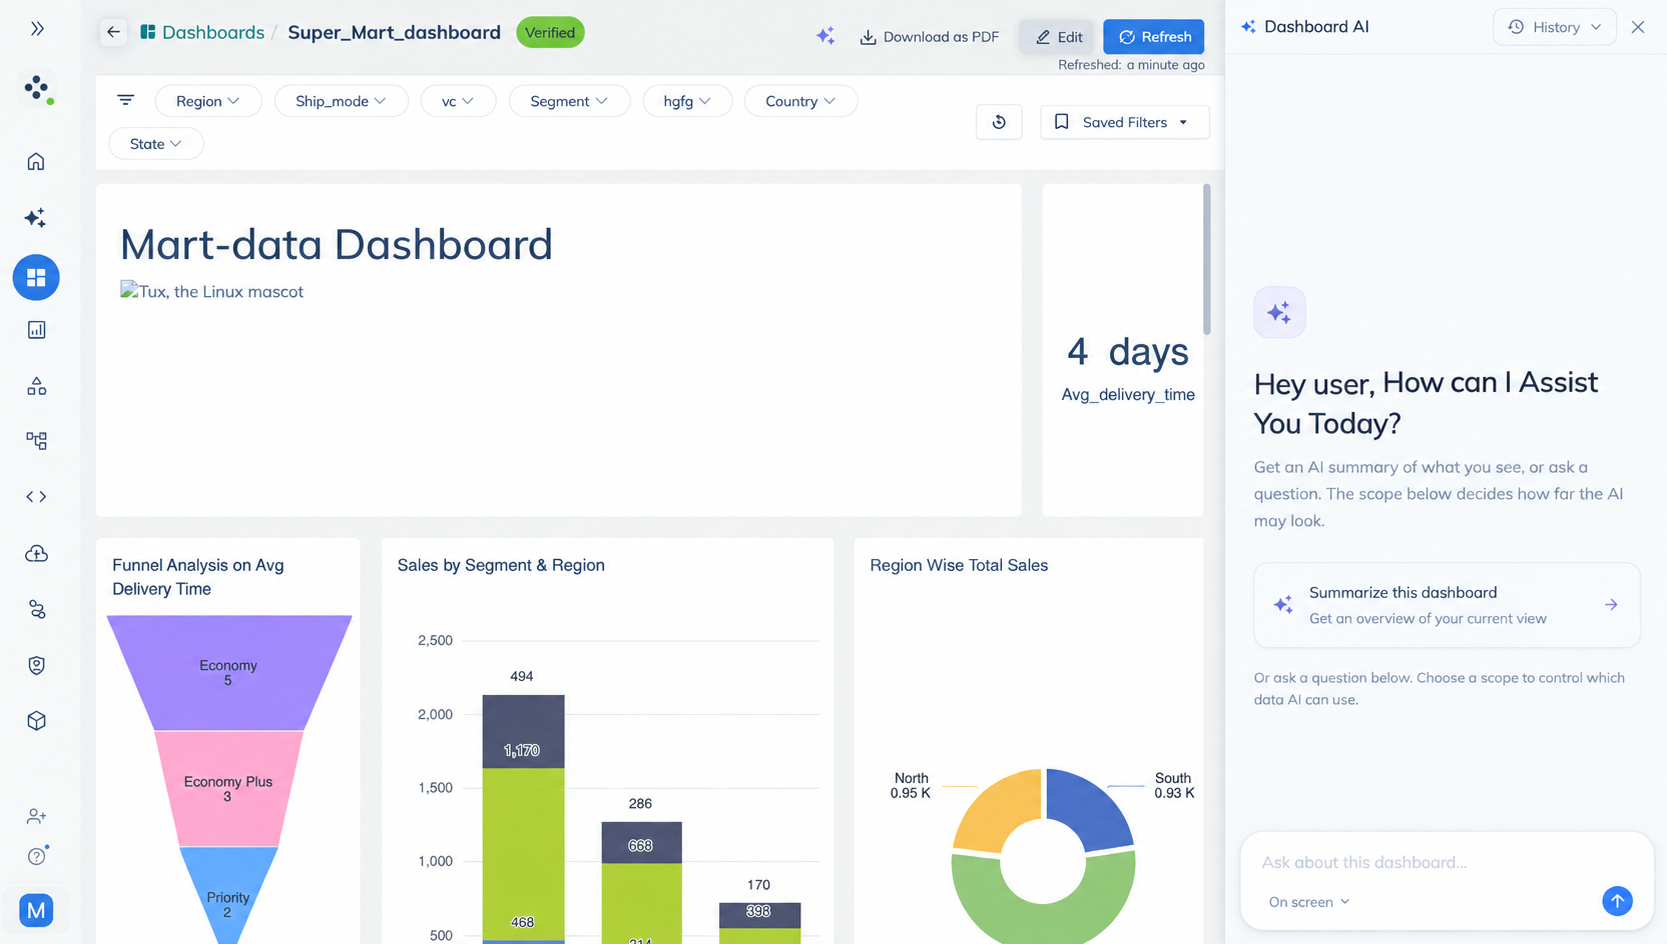
Dashboard AI provides two ways to interact with the dashboard:
- Summarize this dashboard
- Ask a question
Summarize the Dashboard
Section titled “Summarize the Dashboard”Click Summarize this dashboard to generate an AI-powered overview of the dashboard.
The summary is generated based on:
- The pages and tiles configured for the AI summary.
- The Summary prompt, if one has been configured.
- The data available to AI Analyst.
If a summary prompt is configured, AI Analyst uses it to guide the generated summary.
If no summary prompt is configured, AI Analyst generates a general overview of the configured dashboard data.
The summary helps you quickly identify important trends, patterns, and insights without manually reviewing each chart or report.
Ask Questions About the Dashboard
Section titled “Ask Questions About the Dashboard”You can ask AI Analyst questions directly using the input box at the bottom of the Dashboard AI panel.
For example:
Which region has the highest sales?What is the average delivery time?Which segment contributes the most orders?What are the key trends in the current dashboard?Which countries are contributing most to sales?
Enter your question and click Send.
AI Analyst analyzes the available data based on the selected scope and returns the answer.
Change the Data Scope
Section titled “Change the Data Scope”The currently selected scope is displayed below the question input box.
To change the scope:
- Click the scope selector.
- The dropdown displays all scopes enabled in the dashboard settings.
- Select the required scope.
- Enter your question.
- Click Send.
For example, if On screen, Dashboard tables, and Entire project are enabled in the dashboard settings, all three options are available in the scope selector.
The selected scope determines the data that AI Analyst can use for that particular question.
Note: Users can select only the scopes enabled by the dashboard administrator.
Understanding Scope Selection
Section titled “Understanding Scope Selection”Scope selection allows you to control how broadly AI Analyst can analyze the available data.
Use the scopes based on your requirement:
- On screen — Use when you want an answer based strictly on the data currently displayed on the dashboard.
- Dashboard tables — Use when the question requires additional analysis of the data behind the dashboard.
- Entire project — Use when the question requires data that may not be part of the current dashboard.
The dashboard administrator controls which scopes are available, while users can select the appropriate enabled scope when asking individual questions.